GIS Software for Land Development
We empower clients with comprehensive GIS tools, up-to-date data, and dynamic mapping to better understand land and improve development processes.


The challenge
Information gaps limit project success.
Land information has been historically unorganized and spread out across disparate sources, requiring developers to spend significant time searching for data, managing multiple logins, and occasionally traveling to government offices in person to access crucial information.
Intelligence gaps make it difficult to identify development pitfalls or challenges associated with parcels of land, while also taking a toll on project management and client relationships.

The solution
Comprehensive and Collaborative GIS Software for Land Development
Latapult shaves hours – and sometimes days – off the time needed to obtain information. Our premier GIS platform provides detailed property data, enabling teams to more accurately determine land development needs all while collaborating and sharing insights with distributed colleagues and clients.
Partner with us for a better way to plan, prepare, and execute development projects.
We work with land developers nationwide. Put your trust in experienced hands.
-
300+
Businesses nationwide
Supported in uncovering insights that transform projects.
-
50x
Faster land research
To justify, approve, and negotiate land deals quickly and strategically.
-
$1K+
In savings a month per user
On resources, labor, and more.
-
$1M+
In GIS data
Powering environmental, demographic, geospatial, and topographic insights.
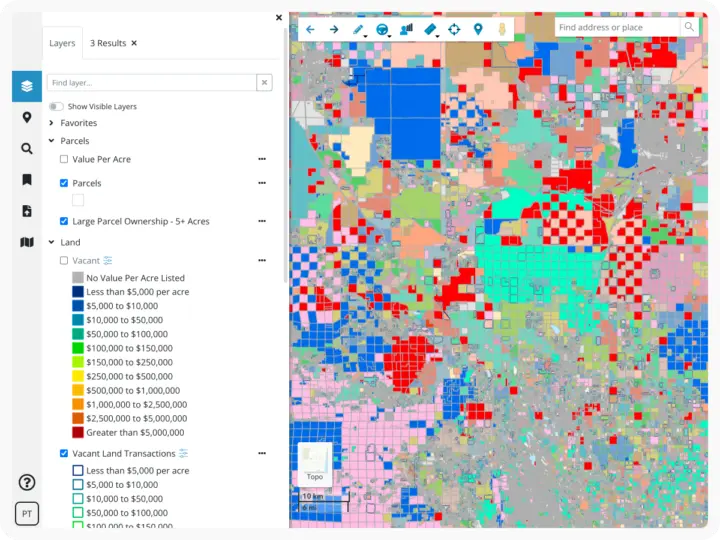
Flexible Platform with Up-to-Date Data
To be successful, developers need land that meets their criteria. Comprehensive data can eliminate project pitfalls, improve project management workflows, and enhance client relationships—giving developers a competitive edge. When searching for important data such as wetlands, soils, elevation, FEMA zones, and more, our property data helps gain a holistic view of land.
Eliminate manual research and gain a better understanding of development sites in minutes with Latapult.
Customizable Layers and Integrations for Unique Needs
Sometimes organizations benefit from a tailor-made GIS platform. Whether they need to import attribute-level data, improve workflows with project tracking, or integrate with other systems like a CRM, our team of GIS experts can tailor our software to any organization.
We love helping clients take our data and collaboration tools to the next level to solve their unique challenges.
Dynamic Mapping Software for Land Development
View All Features
Review Local Consumer Needs
Analyze the demographics and property proximity of an area with strong visuals to understand the consumer needs surrounding your development site.

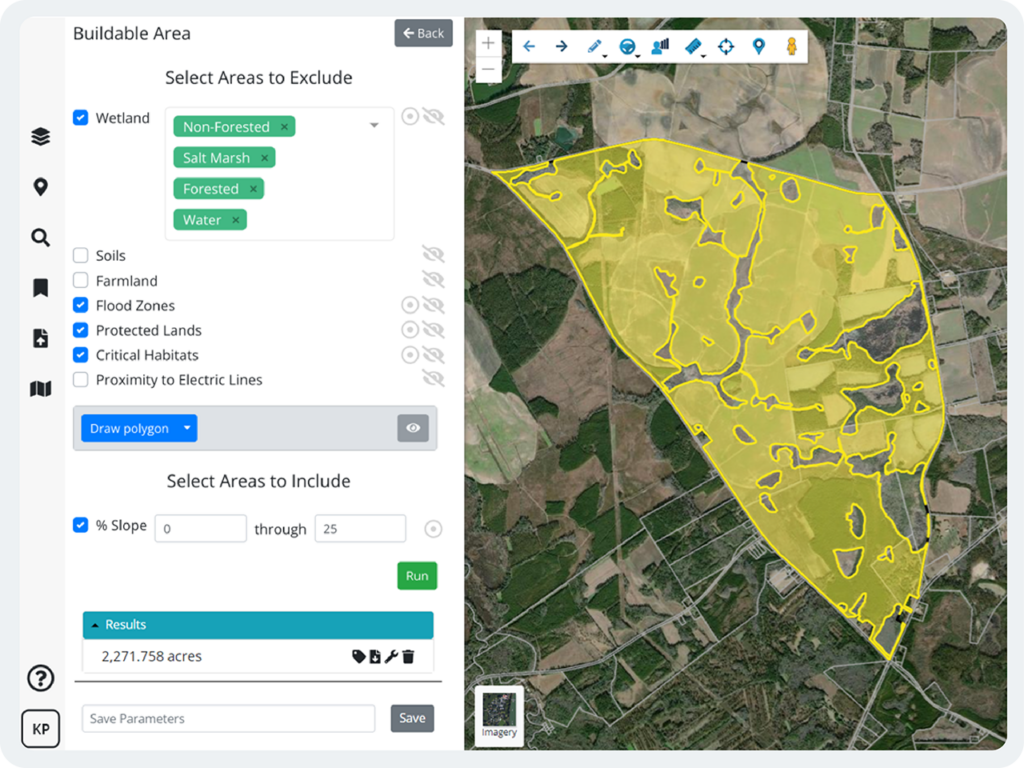
Determine Buildability of Areas
Evaluate land against environmental risks for buildability to understand if the build of an area or property is feasible and develop site plans accordingly.

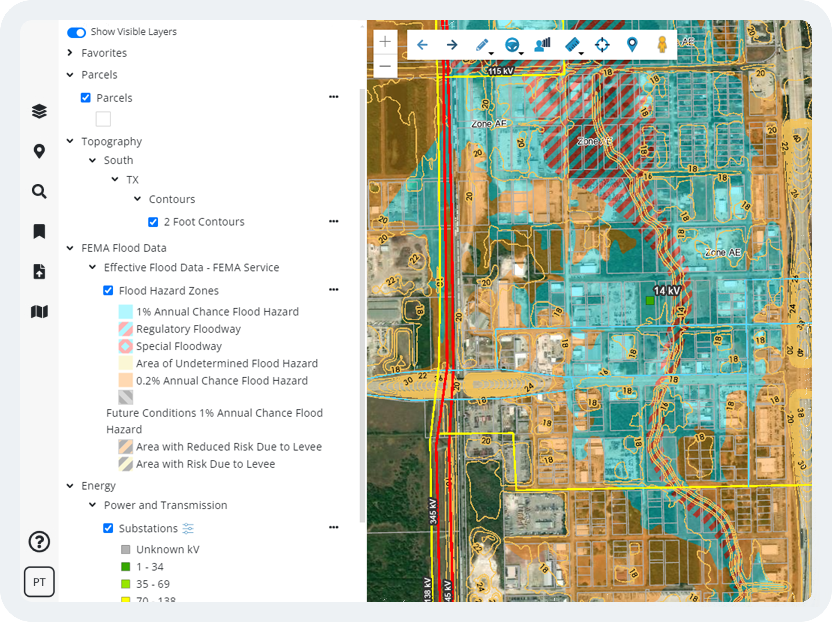
Consolidate Data
Explore, search, and export geometry and tabular property data from across the country and overlay your own data to fit your internal workflows, mapping needs, and team or project management processes.

Create a Map for Reports
Draw graphics and print PDF maps to build quality, professional-grade investor reports and presentations in minutes to convey information visually.

Get Organized
Whether on the go or shifting focus during the work day, save your land mapping work for later, share it with your team or build an interactive presentation of project sites.

Collaborate on Development Projects
Create and organize pins to get your ideas and data on the map — giving you a better way to manage the due diligence process and keep in-touch with team members in both on-site and in-office roles.
What Our Clients Say About Us