How to Interact with Latapult’s Census Data
August 23, 2018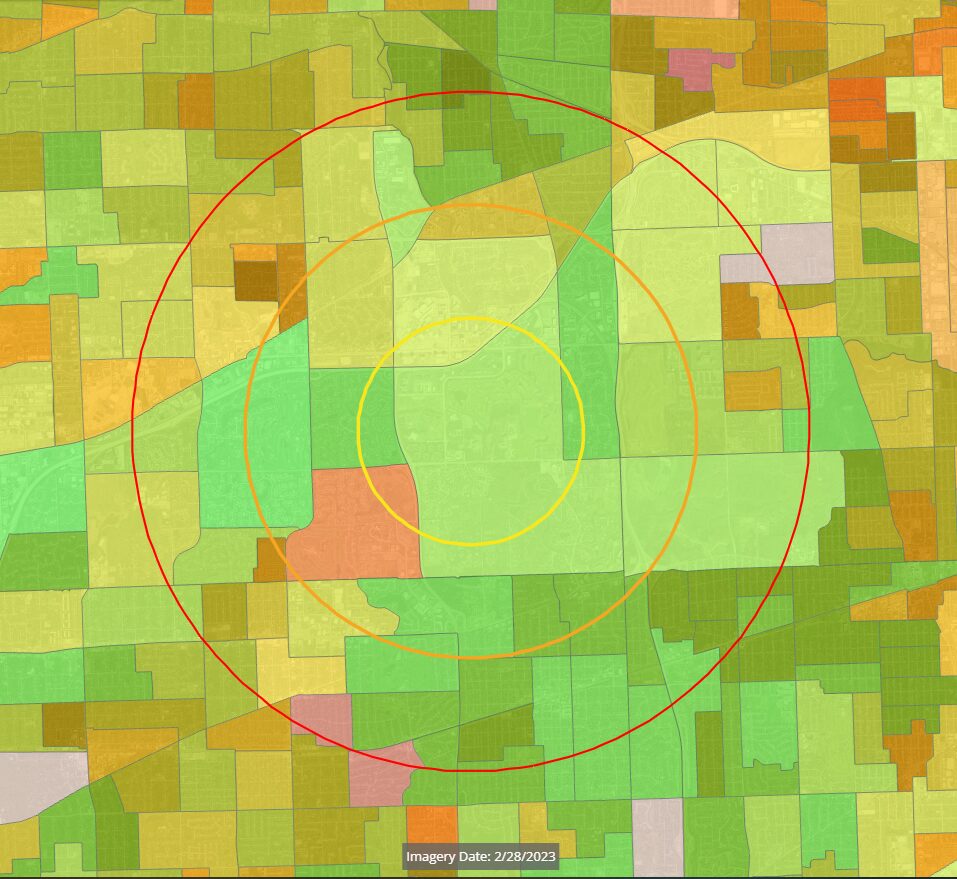
Every year, the US Census Bureau releases a treasure trove of data from its American Community Survey, representing the most up-to-date estimates of demographics throughout the country. In Latapult, this data lives and breathes on the map, but also in a simple yet comprehensive report for any area, large or small.
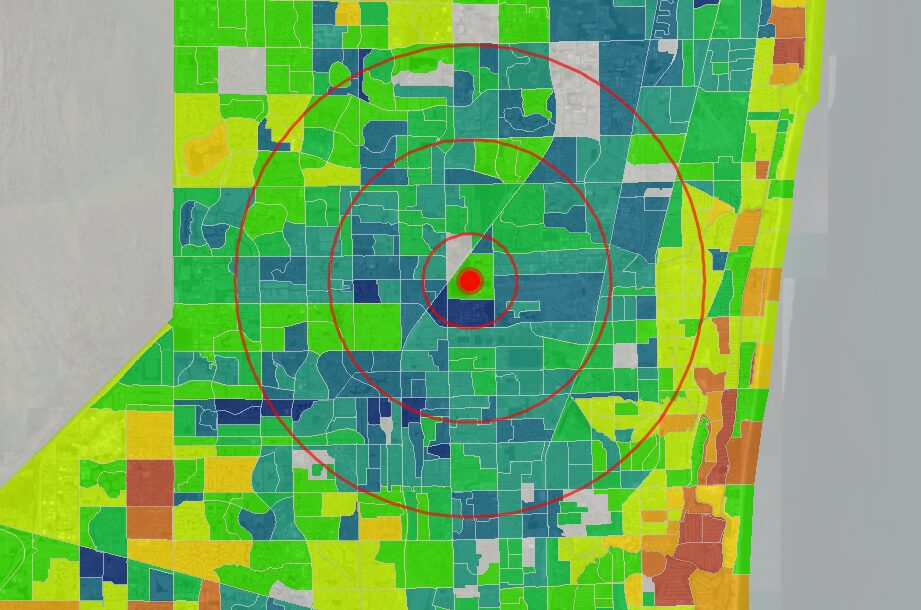
Scroll through maps that give clear pictures of data like household income, commute times, and age. Alternatively, pick a place that’s of interest to you on the map, select your search radius, and in an instant, a clear, concise breakdown of all Census demographics is at your fingertips. Census data is updated yearly and includes attributes vital for understanding the makeup of an area like population, age, sex, race, household income and occupancy, home values, mode of transportation, migration, and job industries.
How do clients use this tool?
Commercial and residential developers maximize their profit when a project fits the needs of the greater community. With Latapult’s census mapping and reporting, developers analyze housing stock, commute times, median income, and gaps in the labor market to help pinpoint the location and type of development to build. For example, analyzing the number of seniors in the search area chosen by an adult community developer, coupled with the median income information for ages 65 and up, would inform the developer on whether to target a modest or luxury senior living development.
With Latapult’s census mapping and reporting, developers analyze housing stock, commute times, median income, and gaps in the labor market to help pinpoint the location and type of development to build.